
Study Area
|
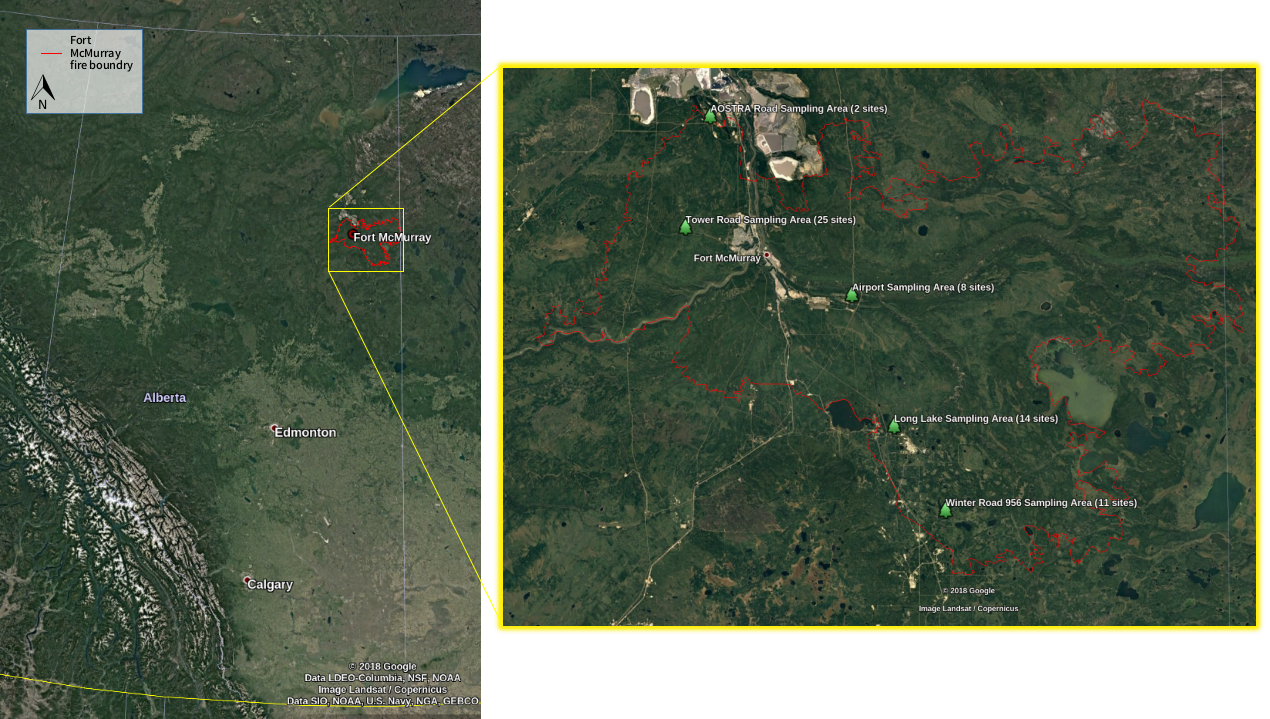
This study took place on the Fort McMurray fire, which burned an area of 589,617 hectares (Natural Resources Canada, 2017). By area this is Canada’s fourth largest wildfire on record (Natural Resources Canada, 2017). The Fort McMurray Fire started on May 1, 2017 and was not classified as under control until July 5, 2016 (Natural Resources Canada, 2017). Record high temperatures, low relative humidity, and strong winds caused the fire to undergo a dramatic increase in size shortly after ignition (Kochtubajda et al., 2017). At the time of the fire, the green-up of vegetation had not begun, resulting in dry fuel being available on the forest floor (Kochtubajda et al., 2017). These extreme weather and fuel conditions made the Fort McMurray wildfire very difficult to manage.
|
Field Methods
After initial scouting, it was determined that while aspen stands burned across a gradient of different fire severities, black spruce stands only burned at high severities. This discrepancy in burn severities caused us to select sites differently for each stand type. Aspen-dominant (≥80% aspen) stands were chosen across a gradient of fire severities, and were all approximately the same age. There were a total of 41 aspen stands selected, with 12 replications at each fire severity level (low, moderate, and high) and 5 control (unburnt) sites. Black spruce-dominant stands were chosen by two general habitat types of black spruce in the area: upland and bog. Upland sites were characterized by having drier mineral soil, with larger trees. Bog sites were characterized by having wet organic soil, with smaller trees. Trees in both habitat types were approximately the same age. There were a total of 30 black spruce stands selected, with 12 replications in each habitat type and 3 replications in control stands for each habitat type.
Measurement plots were randomly placed in appropriate stands. Each plot had a radius of 5.67m (Figure 1). At each plot tree regeneration, fire severity, and stand characteristics were determined and soil was sampled. To estimate burn severity the Composite Burn Index (CBI) was used. Stand characteristics of overstory trees were measured in each 5.67m plot. Measurements included diameter at breast height (DBH), canopy height, and stand age. DBH was taken from all trees with a DBH >7cm within the 5.67m plot. Canopy height was determined by measuring the heights of three average overstory trees. Tree cores were taken at breast height from three average sized overstory trees to estimate stand age.
Tree regeneration and understory vegetation cover, the response variables, were measured using 20 subplots randomly placed along North to South and East to West running transects within each plot. Subplot size depended on the stand type. Subplot size in aspen stands was 50cm x 50cm, as regeneration was very high. Subplots in black spruce stands were 100cm x 100cm, as regeneration rates were lower. In each subplot, seedlings or suckers were tallied then averaged for the stand. Understory vegetation percent cover was also estimated in each subplot for each functional group: trees (<1.3 m), shrubs, forbs, grasses, and bryophytes.

Figure 1. Field plot setup with transects for measuring seedling densities and vegetation percent cover, and a circular plot for measuring pre-fire stand characteristics
Data Analysis
In order to determine if there is a difference in regeneration between fire severity classes, habitat types, and pre-fire stand characteristics MANOVAs and perMANOVAs were be performed. Ordinations (NMDS and PCoA) were created to visualize the differences between the different conditions. Regression trees were also created to visualize a pathway for the most/least regeneration in each habitat type.
